
Notes to the condensed interim consolidated financial statements
Note 1 General information
Corporate information
Cloudberry Clean Energy ASA (“the Company”), its subsidiaries and investments in associated companies and joint ventures (“the Group” or “Cloudberry”) is an independent power producer, developing, owning and operating renewable assets in the Nordics. Cloudberry has an integrated business model across the life cycle of renewable power assets including project development, construction, financing, ownership, operation and management.
Cloudberry Clean Energy ASA is incorporated and domiciled in Norway. The address of its registered office is Frøyas gate 15, NO-0273 Oslo, Norway. Cloudberry Clean Energy ASA was established on 10 November 2017. The Company is listed on the Oslo Stock Exchange main list (ticker: CLOUD).
The condensed interim consolidated financial statements for the first quarter of 2026 were authorized by the Board of Directors for issue on 11 May 2026.
The accounting policies applied by Cloudberry in these interim financial statements are consistent with those of the financial year 2025. The presentation currency is NOK (Norwegian Krone).
Note 2 Acquisitions, disposals and business combinations
Acquisition of 50% of Finnish wind portfolio
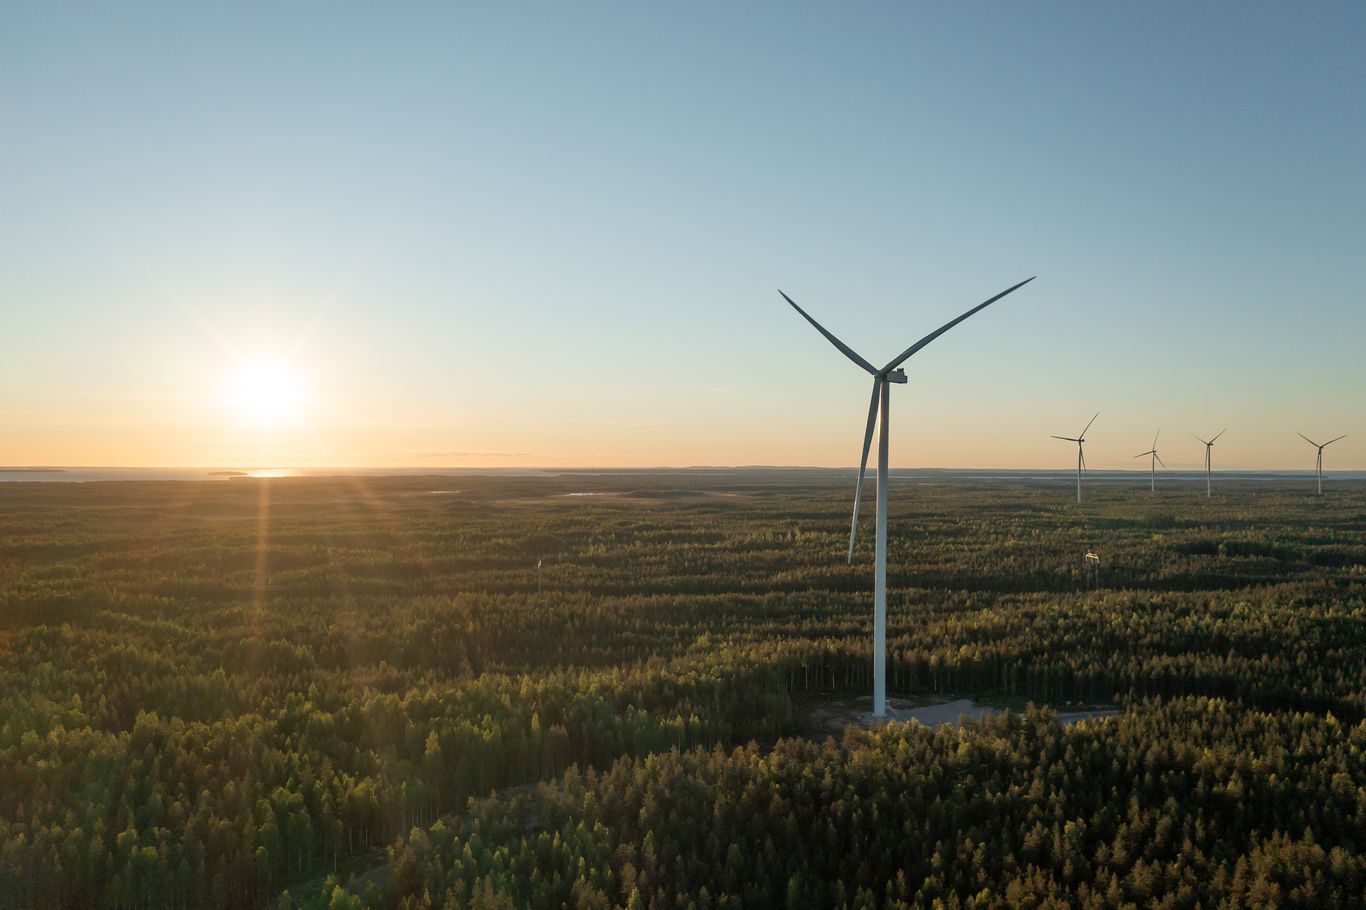
In March 2026 Cloudberry acquired 100% of the shares in Sampi Renewables AS, which indirectly owns a 50% interest in the Metsälamminkangas (MLK) onshore wind farm in Finland. MLK has an installed capacity of 132 MW and expected annual production of approximately 378 GWh on a 100% basis (189 GWh proportionate to Cloudberry). The share purchase agreement was signed on 13 March 2026 and completed on 18 March 2026, which is the accounting acquisition date. The acquisition is accounted for as a business combination under IFRS 3, while the 50% interest in MLK is held through a jointly controlled structure and accounted for as a joint venture in accordance with IFRS 11 and IAS 28 using the equity method.
Total consideration transferred amounts to EUR 22.97 million and comprises:
- EUR 2.97m in cash
- EUR 20m in equity, settled through the issuance of 17,980,314 new shares in Cloudberry Clean Energy ASA
The share consideration is measured at fair value based on the 20‑day volume‑weighted average price (VWAP) of Cloudberry’s shares as of the signing date. Given the relatively low trading liquidity in the share, the 20‑day VWAP is considered a more reliable proxy for market value than a single closing price for the purchase price allocation.
The purchase price allocation is based on an independent valuation of MLK prepared by a third party valuation expert, indicating a fair value of EUR 83m for Cloudberry’s 50% joint venture interest. The increase in value compared to the transaction enterprise value of EUR 75m, can be explained by updated power curves following the recent spike in energy prices, and a market-based approach to the weighted cost of capital (WACC). This results in a value uplift of close to EUR 6m on the MLK joint venture investment compared to Sampi’s carrying amount. Other assets and liabilities in the Sampi group are considered to be close to fair value, so the only material fair value adjustment in the PPA relates to the MLK joint venture investment accounted for using the equity method.
The identifiable net assets acquired are valued at EUR 29m, compared to total consideration of EUR 23m, resulting in a bargain purchase gain of EUR 6m (approximately NOK 66m). The gain is recognized in Q1 2026 in profit or loss within “Net income from associated companies and joint ventures”. In the proportionate financials the gain is presented as other income in total revenue.
Note 3 Operating segments
The Group reports its operations in four operating segments, see chapter “Operational review” for further information on each segment.
The Group reports proportionate financials for each operating segment under the alternative performance measures (APM), which is aligned with internal management reporting. Proportionate financials represent Cloudberry’s proportionate share of the results of all entities and without eliminations based on Cloudberry’s economic interest. The proportionate reporting recognizes Cloudberry’s proportionate share of results for entities that are not consolidated and consolidated subsidiaries held at less than 100%, excluding the share of non-controlling interest.
Proportionate financials are further defined and described in the APM section of this report.
The tables below show the proportionate segment reporting for the respective periods Q1 2026, Q1 2025, and FY 2025. The tables include a reconciliation of the Group consolidated IFRS reported figures. Please refer to the APM section of this report for further reconciliation to the Group IFRS reported figures.
| Q1 2026 | |||||||||
|---|---|---|---|---|---|---|---|---|---|
| NOK million | Projects | Commercial | Asset Management | Corporate | Total proportionate | Group eliminations | Elim. of equity consol. ent. | Residual ownership consol. ent. | Total consolidated |
| Total revenue | 13 | 270 | 22 | 1 | 306 | -7 | -128 | 23 | 194 |
| Operating expenses ex depreciation and amortization | -21 | -62 | -19 | -13 | -115 | 7 | 26 | -13 | -96 |
| Net income/(loss) from associated companies | - | - | - | - | - | - | 80 | - | 80 |
| EBITDA | -7 | 208 | 3 | -12 | 191 | -0 | -22 | 9 | 178 |
| Depreciation, amortisation and write down | -2 | -59 | -2 | -1 | -64 | 3 | 16 | -10 | -55 |
| Operating profit (EBIT) | -9 | 148 | 1 | -13 | 127 | 3 | -6 | -1 | 123 |
| Net financial items | 27 | -46 | -0 | -14 | -33 | 0 | 6 | 6 | -21 |
| Profit/(loss) before tax | 18 | 102 | 1 | -26 | 94 | 3 | -0 | 5 | 102 |
| Total assets | 779 | 8 012 | 182 | 487 | 9 461 | -317 | -753 | 1 413 | 9 804 |
| Interest bearing debt | 35 | 3 460 | - | - | 3 494 | - | -453 | 594 | 3 636 |
| Cash | 67 | 240 | 43 | 408 | 758 | - | -98 | 74 | 733 |
| NIBD | -33 | 3 220 | -43 | -408 | 2 737 | - | -354 | 520 | 2 903 |
Note to proportionate cash balance for Q1 2026: Odal further has ~NOK 130m proportionate to Cloudberry in restricted cash mainly towards Siemens Gamesa and the project financing which is not reported under proportionate cash but included under total assets.
| Q1 2025 | |||||||||
|---|---|---|---|---|---|---|---|---|---|
| NOK million | Projects | Commercial | Asset Management | Corporate | Total proportionate | Group eliminations | Elim. of equity consol. ent. | Residual ownership consol. ent. | Total consolidated |
| Total revenue | 1 | 139 | 12 | 0 | 152 | -3 | -49 | 22 | 121 |
| Operating expenses ex depreciation and amortization | -7 | -56 | -14 | -14 | -90 | 3 | 22 | -7 | -71 |
| Net income/(loss) from associated companies | - | - | - | - | - | - | 8 | - | 8 |
| EBITDA | -6 | 83 | -1 | -13 | 62 | 0 | -19 | 15 | 58 |
| Depreciation, amortisation and write down | -0 | -53 | -1 | -1 | -55 | 3 | 16 | -6 | -43 |
| Operating profit (EBIT) | -6 | 30 | -3 | -14 | 7 | 3 | -3 | 9 | 15 |
| Net financial items | -13 | -8 | 0 | -0 | -21 | 6 | -1 | -8 | -24 |
| Profit/(loss) before tax | -19 | 21 | -2 | -14 | -14 | 9 | -3 | 1 | -9 |
| Total assets | 268 | 7 893 | 200 | 203 | 8 564 | -380 | -411 | -472 | 7 301 |
| Interest bearing debt | - | 2 949 | 0 | - | 2 949 | - | 2 218 | -2 949 | 2 218 |
| Cash | 67 | 608 | 14 | 114 | 804 | - | -74 | 8 | 737 |
| NIBD | -67 | 2 340 | -14 | -114 | 2 145 | - | 2 293 | -2 956 | 1 482 |
| FY 2025 | |||||||||
|---|---|---|---|---|---|---|---|---|---|
| NOK million | Projects | Commercial | Asset Management | Corporate | Total proportionate | Group eliminations | Elim. of equity consol. ent. | Residual ownership consol. ent. | Total consolidated |
| Total revenue | 42 | 578 | 75 | 2 | 697 | -34 | -190 | 98 | 571 |
| Operating expenses ex depreciation and amortization | -61 | -251 | -71 | -58 | -441 | 34 | 105 | -54 | -357 |
| Net income/(loss) from associated companies | - | - | - | - | - | - | 119 | - | 119 |
| EBITDA | -19 | 327 | 4 | -55 | 256 | 0 | 34 | 44 | 333 |
| Depreciation, amortisation and write down | -9 | -285 | -7 | -3 | -304 | 58 | 62 | -22 | -206 |
| Operating profit (EBIT) | -28 | 42 | -4 | -58 | -48 | 58 | 96 | 22 | 127 |
| Net financial items | 36 | -113 | 0 | 7 | -69 | 40 | 7 | -4 | -27 |
| Profit/(loss) before tax | 8 | -71 | -4 | -51 | -118 | 98 | 103 | 18 | 100 |
| Total assets | 767 | 7 385 | 167 | 722 | 9 042 | -358 | -1 243 | 1 992 | 9 434 |
| Interest bearing debt | 36 | 3 137 | - | - | 3 173 | - | -891 | 1 026 | 3 308 |
| Cash | 84 | 141 | 27 | 638 | 891 | - | -98 | 100 | 893 |
| NIBD | -48 | 2 996 | -27 | -638 | 2 282 | - | -792 | 926 | 2 416 |
Note 4 Net financial costs and significant fair value measures
| NOK million | Q1 2026 | Q1 2025 | FY 2025 |
|---|---|---|---|
| Interest income | 3 | 5 | 33 |
| Other financial income | 16 | 2 | 28 |
| Exchange differences | 98 | 51 | 180 |
| Total financial income | 117 | 59 | 240 |
| NOK million | Q1 2026 | Q1 2025 | FY 2025 |
|---|---|---|---|
| Interest expenses | -33 | -21 | -109 |
| Other financial expenses | -0 | -1 | -3 |
| Exchange differences | -109 | -61 | -165 |
| Capitalized interest | 5 | - | 11 |
| Total financial expenses | -138 | -83 | -267 |
Derivatives and fair value measures
The Group uses derivative financial instruments to hedge interest-rate, currency and power price-risk exposures. For a detailed description of financial risks, financial instruments and hedge accounting, reference is made to note 7 and note 8 in the 2025 Annual report.
The table below shows the fair value of the derivatives included in the balance sheet.
| NOK million | 31.03.2026 | 31.12.2025 |
|---|---|---|
| Non-current derivative financial instrument asset | 173 | 180 |
| Current derivative financial instrument asset | 12 | 1 |
| Non-current derivative financial instrument liability | -23 | -21 |
| Current derivative financial instrument liability | - | - |
As of the reporting date, the non-current derivative financial instrument asset relates to interest swap derivatives for NOK 173m, which are classified as non-current financial assets and other assets in the statement of financial position. The current derivative financial instrument asset of NOK 12m is related to currency swap in FVK.
The non-current derivative financial instrument liability relates to interest swap derivatives for NOK 23m and is classified under interest-bearing loans and borrowings.
Note 5 Property, plant and equipment (PPE)
| NOK million | Producing power plants | Power plants under construction | Equipment | Right to use - lease asset | Total property, plant and equipment |
|---|---|---|---|---|---|
| Carrying amount beginning of period | 5 753 | 326 | 0 | 160 | 6 239 |
| Additions from business combinations | - | - | - | - | - |
| Additions | 2 | 48 | - | - | 50 |
| Disposals | - | - | - | - | - |
| Transfer between groups | - | - | - | - | - |
| Transfer from inventory | - | - | - | - | - |
| Depreciations of the year | -51 | - | -0 | -4 | -55 |
| Impairments losses | - | - | - | - | - |
| Effect of movement in FX | -296 | -25 | 0 | -10 | -330 |
| Carrying amount at end of period | 5 409 | 349 | 1 | 146 | 5 904 |
Property, plant and equipment decreased slightly in the first quarter, mainly due to negative foreign exchange effects on producing power plants and, to a lesser extent, plants under construction. The only material addition of the period was the NOK 48 million addition to power plants under construction to plants under Forte Vannkraft. There were no significant disposals, transfers or impairments, and ordinary depreciation also contributed to the decline in the carrying amount.
Note 6 Investment in associated companies and joint ventures
Investments in associated companies and joint ventures are accounted for using the equity method. Please refer to the 2025 annual report, note 16, for detailed information about entities classified as associated companies and joint ventures.
The table shows the summarized financial information in the Group accounts for equity accounted companies.
| NOK million | Odal Vind AS | Odin portfolio | MLK | FVK: Småvoll & Osaelva | Dingelsundet | Other | Total |
|---|---|---|---|---|---|---|---|
| Book value as beginning of year | 530 | 343 | - | 78 | 72 | 60 | 1 083 |
| Additions from business combinations | - | - | 387 | - | - | - | 387 |
| Share of profit/loss for the period | 5 | 12 | -2 | 0 | - | 0 | 15 |
| Depreciation of excess value | -0 | -2 | - | - | - | -0 | -2 |
| Dividend paid to the owners | - | -11 | - | - | - | - | -11 |
| Currency translation differences (OCI) | -27 | -19 | 7 | -4 | - | -2 | -45 |
| Items charges to equity (OCI) | - | - | - | - | - | - | - |
| Book value at reporting date | 508 | 324 | 392 | 74 | 72 | 59 | 1 427 |
| Excess value beginning of year | 17 | 197 | - | 38 | - | 31 | 282 |
| Excess value at reporting date | 17 | 184 | 66 | 36 | - | 29 | 332 |
Investments in associates and joint ventures increased in the quarter, mainly driven by Cloudberry’s acquisition of a 50% ownership stake in the MLK onshore wind farm in Finland, recognized under additions from business combinations and representing the largest change in the portfolio. Remaining movements in the carrying amount are explained by the Group’s share of profit and loss, depreciation of excess values, dividend distributions from the Odin portfolio and currency translation effects.
Investments reported under “Other” relate primarily to Duvhällen, Kaia, Norhard and Holstebro-Struer.
Note 7 Non-current financial assets and other assets
| NOK million | 31.03.2026 | 31.12.2025 |
|---|---|---|
| Intangible assets | 2 | 3 |
| Deferred tax asset | 38 | 41 |
| Investment in other shares | 66 | 66 |
| Derivative assets | 173 | 183 |
| Non-current loan to ass.comp and JVs | 644 | 86 |
| Other non-current assets | 92 | 84 |
| Total non-current financial assets and other assets | 1 015 | 461 |
Note 8 Inventory
| NOK million | Projects - with construction permit | Projects - backlog | Total |
|---|---|---|---|
| Project inventory beginning of period | 80 | 89 | 169 |
| Acquisitions through business combinations | - | - | - |
| Acquisitions during the year | - | - | - |
| Capitalized right of lease asset | - | - | - |
| Capitalization (salary, borrowing cost, other expenses) | 5 | 3 | 8 |
| Disposals | - | - | - |
| Transfer to PPE | - | - | - |
| Write down current year | - | - | - |
| Effects of movements in foreign exchange | -4 | -1 | -5 |
| Project inventory end of period | 81 | 91 | 172 |
Note 9 Cash and cash equivalents
The Group has the following cash and cash equivalents as per 31 March 2026:
| NOK million | 31.03.2026 | 31.12.2025 |
|---|---|---|
| Bank deposits | 576 | 735 |
| Money market funds | 157 | 158 |
| Total cash and cash equivalents | 733 | 893 |
Investments in money market funds consist of investments in KLP and Fondsforvaltning. These placements are short-term and readily convertible to cash.
Restricted cash is not included in cash and cash equivalents; if cash is restricted, it is classified as other current assets.
Note 10 Interest-bearing debt and guarantees
The Group has the following interest-bearing debt as per 31 March 2026.
| NOK million | 31.03.2026 | 31.12.2025 |
|---|---|---|
| Non-current interest-bearing debt and borrowings | 1 857 | 3 148 |
| Non-current derivative liability related to hedge accounting | 23 | 21 |
| Total non-current interest-bearing loans and borrowings | 1 881 | 3 169 |
| Current interest-bearing loans and borrowings | 1 756 | 139 |
| Total interest-bearing loans and borrowings to banks | 3 636 | 3 308 |
Cloudberry’s consolidated interest‑bearing debt and main credit facilities are largely unchanged compared to year‑end 2025. For a detailed description of the Group’s bank facilities in the Group, applicable covenants and interest terms, reference is made to note 21 “Interest‑bearing debt and debt facilities” and note 8 “Derivative financial instruments” in the 2025 Annual report.
For a description of the changes in interest‑bearing loans and borrowings in 2026, reference is made to the financial review section under statement of financial position.
As of the reporting date, the Group remains in full compliance with all financial covenants, and around 70% of proportionate interest‑bearing debt is hedged at an all‑in fixed rate of approximately 4% with a weighted average tenor of around 9 years.
Cloudberry has a NOK 2.2 billion corporate debt facility maturing in Q1 2027, which explains the significant reclassification from long‑term to short‑term interest‑bearing debt in the quarter. The Company has initiated a refinancing process for this facility, with good progress to date.
As of the reporting date, the Group remains in full compliance with all financial covenants, and around 70% of proportionate interest‑bearing debt is hedged at an all‑in fixed rate of approximately 4% with a weighted average tenor of around 9 years.
For a description of the changes in interest‑bearing non‑current borrowings in 2026, reference is made to the financial review section under statement of financial position.
New guarantees and commitments 2026
There were no new guarantees or contractual commitments in the first quarter of 2026. Existing guarantees and obligations, including remaining capex in the Forte Vannkraft portfolio and the EUR 3.5 million guarantee related to Norhard, are unchanged from year end 2025 and are not reflected in the consolidated accounts. For further details, reference is made to note 22 “Provisions, guarantees and other contractual obligations” in the 2025 Annual report.